TriesteVillas · Guide
The Bora, measured
Trieste's wind in real numbers: how strong, when and where. And what it means if you are choosing a home.
We are an estate agency, not an observatory. For every home we measure the sun, the elevation and the sea; here we do the same with the wind, using data from ARPA FVG, the FVG Civil Protection, OGS, NOAA and Copernicus.
Updated 25 October 202630 sourced notesWritten with AI
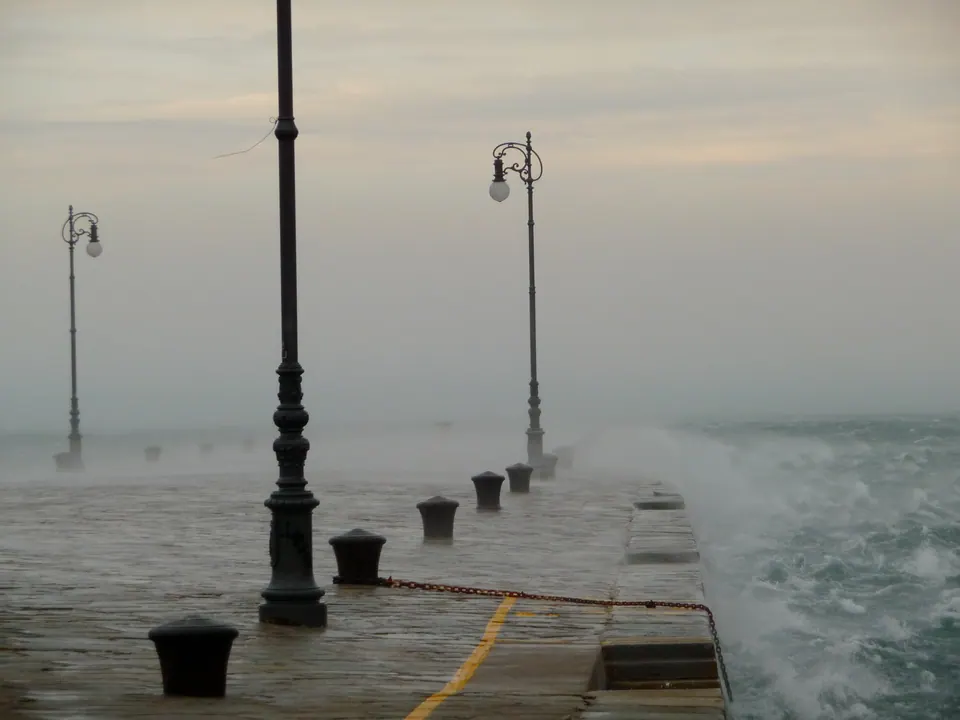
- days a year with at least three hours of Bora above 18 km/h2
- 147
- days a year with Bora gusts of 60 km/h or more2
- 74
- the year's strongest gust at the Molo, on average12
- 128km/h
- ARPA's record at the Molo, 11 February 201213
- 168km/h
The essentials take two minutes; each chapter opens up for those who want the detail.
01. When
All year round. Summer included.
Most from October to March: in January, October and December about 15 days a month have at least three hours of Bora. Least in May and June, about 8. And in July and August, 10 to 12 days a month.
Sources2
- Bora with gusts of 60 km/h or more
- Bora: at least 3 hours above 18 km/h
- no Bora
147 Bora days a year, 74 with gusts of 60 km/h or more
Mostly at night and in the morning. The peak is around 07:00: Bora in 24 hours out of a hundred. The low is around 15:00: 13 out of a hundred.
The calendar in detail
At the Trieste station, in the consistent years, hours of Bora above 18 km/h made up 29% of the hours in January and 27% in October; in May and June 10%.2 Counting days: in January, October and December about fifteen with at least three hours of Bora, and nine or ten with gusts of 60 km/h or more; in June 8 days of Bora and 3 with gusts like that.2
days with at least 3 hours of Bora above 18 km/hdays with Bora gusts of 60 km/h or moreaxis: days per month
| Jan | 15.2 | 9.5 |
| Feb | 12.5 | 7.0 |
| Mar | 13.4 | 8.5 |
| Apr | 11.1 | 5.0 |
| May | 8.1 | 3.8 |
| Jun | 8.0 | 2.9 |
| Jul | 10.1 | 3.6 |
| Aug | 11.9 | 3.9 |
| Sept | 14.4 | 4.1 |
| Oct | 15.6 | 8.8 |
| Nov | 11.8 | 7.1 |
| Dec | 15.0 | 9.6 |
So yes, there is Bora in summer: in July and August from 10 to 12 days a month, with three or four days of gusts of 60 km/h.2
The time of day matters too. The Bora blows more often at night and in the morning, peaking around 07:00 (24% of hours), and less in the early afternoon: 13% at 15:00.2
| 00:00 | 21% |
| 01:00 | 21% |
| 02:00 | 22% |
| 03:00 | 22% |
| 04:00 | 23% |
| 05:00 | 23% |
| 06:00 | 24% |
| 07:00 | 24% |
| 08:00 | 24% |
| 09:00 | 22% |
| 10:00 | 20% |
| 11:00 | 18% |
| 12:00 | 17% |
| 13:00 | 15% |
| 14:00 | 14% |
| 15:00 | 13% |
| 16:00 | 14% |
| 17:00 | 15% |
| 18:00 | 16% |
| 19:00 | 16% |
| 20:00 | 18% |
| 21:00 | 19% |
| 22:00 | 19% |
| 23:00 | 20% |
An episode lasts 8 hours in the median; one in ten goes beyond 30. The longest, in the years considered, lasted 146 hours: about 6 days.7
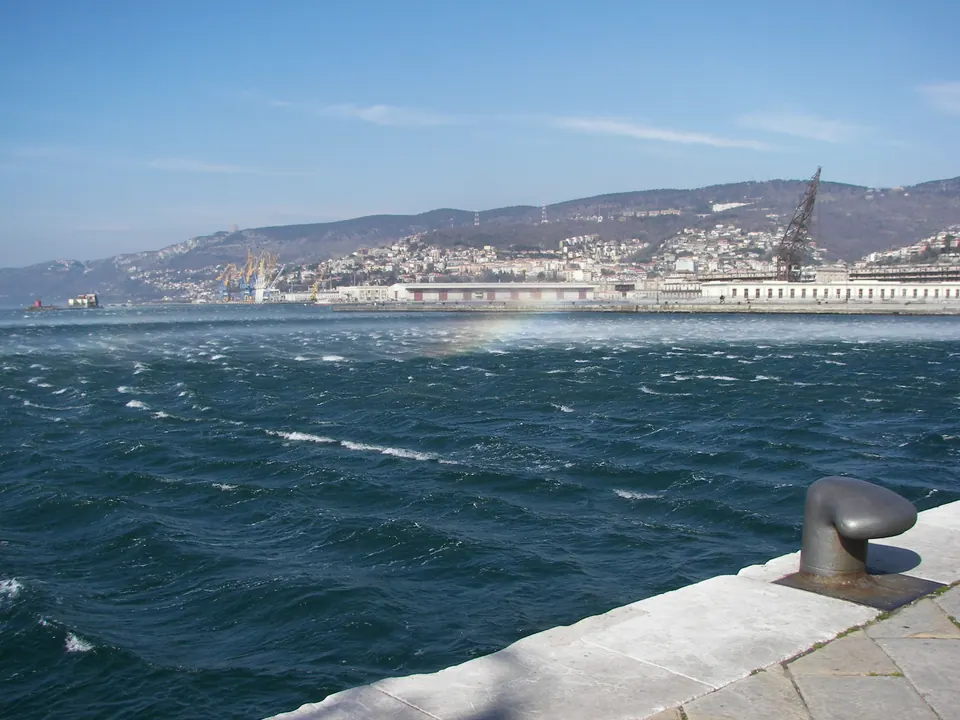
One year is not a climate, but the picture holds. Between September 2025 and October 2026 the Molo F.lli Bandiera had 49 Bora episodes, at least one in every month of the year: just one in May and one in June.8,29 The strongest ran from 20 to 22 November 2025: 42 hours, with a gust of 119 km/h; the longest, from 4 to 8 January 2026, lasted 95 hours, almost four days.29 In summer, between June and August 2026, there were 9 episodes; the strongest, on the night of 7 to 8 August, had a gust of 81 km/h.29
winter, November to Marchthe strongest · 8 August, in the 3D view
All the episodes, one by one (49)
| Start | Hours | Mean wind | Strongest gust |
|---|---|---|---|
| 27 September 2025, 06:00 | 35 | 31 km/h | 70 km/h |
| 30 September 2025, 22:00 | 24 | 39 km/h | 82 km/h |
| 5 October 2025, 06:00 | 10 | 43 km/h | 107 km/h |
| 26 October 2025, 19:00 | 11 | 34 km/h | 65 km/h |
| 18 November 2025, 00:00 | 32 | 44 km/h | 90 km/h |
| 20 November 2025, 21:00 | 42 | 53 km/h | 119 km/h |
| 22 November 2025, 18:00 | 9 | 28 km/h | 61 km/h |
| 26 November 2025, 09:00 | 46 | 38 km/h | 98 km/h |
| 4 December 2025, 13:00 | 14 | 37 km/h | 72 km/h |
| 5 December 2025, 16:00 | 10 | 35 km/h | 64 km/h |
| 23 December 2025, 20:00 | 72 | 56 km/h | 109 km/h |
| 30 December 2025, 14:00 | 12 | 38 km/h | 70 km/h |
| 4 January 2026, 02:00 | 95 | 47 km/h | 110 km/h |
| 11 January 2026, 07:00 | 6 | 40 km/h | 63 km/h |
| 18 January 2026, 01:00 | 49 | 41 km/h | 79 km/h |
| 14 February 2026, 20:00 | 7 | 38 km/h | 77 km/h |
| 20 February 2026, 13:00 | 11 | 33 km/h | 66 km/h |
| 16 March 2026, 20:00 | 28 | 34 km/h | 82 km/h |
| 18 March 2026, 07:00 | 20 | 31 km/h | 91 km/h |
| 19 March 2026, 12:00 | 7 | 27 km/h | 61 km/h |
| 22 March 2026, 03:00 | 9 | 35 km/h | 61 km/h |
| 26 March 2026, 01:00 | 16 | 44 km/h | 94 km/h |
| 31 March 2026, 07:00 | 46 | 43 km/h | 111 km/h |
| 8 April 2026, 04:00 | 9 | 37 km/h | 75 km/h |
| 9 April 2026, 00:00 | 6 | 36 km/h | 66 km/h |
| 13 April 2026, 20:00 | 25 | 32 km/h | 66 km/h |
| 15 April 2026, 02:00 | 19 | 30 km/h | 66 km/h |
| 21 April 2026, 18:00 | 27 | 35 km/h | 72 km/h |
| 27 April 2026, 00:00 | 11 | 37 km/h | 63 km/h |
| 29 April 2026, 00:00 | 42 | 39 km/h | 84 km/h |
| 12 May 2026, 11:00 | 15 | 34 km/h | 81 km/h |
| 11 June 2026, 03:00 | 26 | 39 km/h | 73 km/h |
| 2 July 2026, 01:00 | 12 | 35 km/h | 75 km/h |
| 18 July 2026, 20:00 | 7 | 36 km/h | 70 km/h |
| 19 July 2026, 21:00 | 15 | 35 km/h | 67 km/h |
| 20 July 2026, 21:00 | 15 | 33 km/h | 64 km/h |
| 21 July 2026, 17:00 | 18 | 32 km/h | 62 km/h |
| 7 August 2026, 21:00 | 23 | 33 km/h | 81 km/h |
| 11 August 2026, 21:00 | 24 | 32 km/h | 61 km/h |
| 13 August 2026, 01:00 | 28 | 31 km/h | 63 km/h |
| 1 September 2026, 04:00 | 8 | 36 km/h | 65 km/h |
| 10 September 2026, 10:00 | 34 | 33 km/h | 70 km/h |
| 21 September 2026, 11:00 | 21 | 34 km/h | 73 km/h |
| 25 September 2026, 00:00 | 13 | 36 km/h | 64 km/h |
| 12 October 2026, 05:00 | 19 | 38 km/h | 76 km/h |
| 22 October 2026, 08:00 | 12 | 33 km/h | 61 km/h |
| 24 October 2026, 10:00 | 11 | 31 km/h | 64 km/h |
| 29 October 2026, 00:00 | 13 | 30 km/h | 61 km/h |
| 29 October 2026, 21:00 | 19 | 34 km/h | 72 km/h |
- 29mean wind when it blows from the north-east · Trieste, 2001-2020 Sources15
- 60Bora gusts from here up: 74 days a year · Trieste station Sources2
- 100from here up: 6.6 days a year · Trieste station Sources2
- 128the year's strongest gust, on average · Molo, since 1994 Sources12
- 153once every ten years · ARPA estimate, Molo Sources12
- 168the record · Molo, 11 February 2012 Sources13
- 176once every fifty years · ARPA estimate, Molo Sources12
- 187on the roof of the Nautical Institute · 10 March 2010 Sources14
Usually 8 hours. One time in ten, more than 30. The longest in the years counted lasted 146 hours: about 6 days.
And in 2012 the Molo had fifteen days in a row with gusts above 100 km/h. Sources713
Strength in detail: months, records, trends
ARPA has measured the wind at the Molo F.lli Bandiera since 1994, ten metres above the ground. The strongest gust of each year has averaged 128 km/h; the highest in the series is 168 km/h, on 11 February 2012, from the east.12,13 From the same data ARPA estimates that a 153 km/h gust returns on average every ten years, a 176 km/h gust every fifty.12
- January106
- February97
- March98
- April89
- May85
- June80
- July85
- August95
- September91
- October94
- November98
- December107
Gusts from any direction: at the Molo, in 318 months out of 381, the strongest of the month was Bora. Source12
Gusts make the news, the mean much less so. From 2001 to 2020, in Trieste, the mean wind at ten metres was 14 km/h; it blew from the north-east 16% of the hours, averaging 29 km/h. Episodes with an hourly mean above 35 km/h for more than five hours in a row, ARPA writes, are not rare.15
How many days of strong wind? At the Molo, from 1994 to 2026, on average 106 days a year with gusts above 54 km/h, 49 above 72 and 17 above 90, and 21 days with a daily mean wind above 36 km/h.12 These counts include every direction, but in Trieste strong wind is almost all Bora: of the 130 months with a maximum gust of 100 km/h or more, 119 were Bora.12 At the Trieste synoptic station, counting Bora only, days with gusts of 60 km/h or more were 74 a year, and days with 100 km/h or more 6.6.2
Other instruments in the city have measured more. On the roof of the Nautical Institute the University of Trieste recorded 52 metres per second, about 187 km/h, on 10 March 2010, while ARPA measured 152 km/h at the Molo: the same Bora strikes places a kilometre apart differently.14,12 Higher figures also circulate, such as 171 km/h in 1954 or 212 km/h in 2010: we have not found them in an official source, and we do not use them here.
Duration has a record too: from 29 January to 12 February 2012 the Molo had fifteen days in a row with gusts above 100 km/h.13 And over time? In the twentieth century the Bora decreased slightly, with swings lasting decades: from 1903 to 1985 wind from north-north-east to east, light wind included, blew on average 42% of the time, the equivalent of 153 days a year.17 Over the last thirty years, at the Molo, days with a mean wind above 36 km/h have stayed almost the same: 22 a year in 1996-2005, 20 in 2006-2025.12 Climate models project slightly less winter Bora in the northern Adriatic, with much uncertainty.18,19
03. Where
Strongest at sea and on the waterfront
Among the stations that measure it, the Bora is strongest out at sea and on the waterfront. On the Karst plateau, in the Bora episodes between September 2025 and October 2026, winter included, the mean wind was 45 to 66% of the Molo's. On the coast road nobody measures it on land: satellites and a buoy do, over the sea.
Molo = 100%
- The open gulf91%–101%
- The waterfront and the centre67%–100%
- Muggia81%
- The coast roadover the sea, by satellite80%–128%
- The coast roadat sea, the buoy off Miramare83%
- The hills and the Karst plateau45%–66%
- Monfalcone and the lagoon28%–72%
Station by station, and the coast road seen by satellite
The Bora does not blow the same everywhere. For each of the 49 Bora episodes between September 2025 and October 2026 we compared the Molo F.lli Bandiera, hour by hour, with the other thirteen stations of the regional weather network around Trieste that measure wind, and with the OGS buoy off Miramare.8,29,30
mean wind, median of the episodes (line: the middle 80% of episodes)strongest gustunder the name, the station's elevation
| Boa Paloma | 5 m | 101% | 88% |
| Trieste molo F.lli Bandiera | 1 m | 100% | 100% |
| Grado Boa Meteo | 0 m | 91% | 79% |
| Boa MAMBO1 (OGS) | 0 m | 83% | 78% |
| Muggia | 2 m | 81% | 85% |
| Monfalcone | 3 m | 72% | 83% |
| Trieste Ist. Nautico | 30 m | 67% | 87% |
| Prosecco | 270 m | 66% | 74% |
| Grado Meteo | 0 m | 55% | 65% |
| Fossalon | 0 m | 50% | 60% |
| Trieste Cattinara | 257 m | 49% | 74% |
| Sgonico-Zgonik | 268 m | 45% | 65% |
| Borgo Grotta Gigante | 275 m | 45% | 61% |
| Gorizia Aeroporto | 68 m | 44% | 59% |
| Doberdo' | 134 m | 28% | 52% |
Out in the gulf, the Paloma buoy had 101% of the Molo's mean wind; Muggia 81%. In the city the Nautical Institute, thirty metres up among the buildings, had 67% of the mean but 87% of the strongest gust: among buildings the mean drops more than the gusts.29 On the Karst plateau, around 270 metres, Prosecco had 66%, Sgonico 45%, Borgo Grotta Gigante 45%; Cattinara, on the city's hill, 49%.29
In winter, when the Bora is stronger, the ratios of the regional network's stations change by only a few percentage points. In the winter episodes, between November and March, Muggia had 86% of the Molo's mean wind, against 79% in the rest of the year; Cattinara 45%, against 54%; the Paloma buoy 106%, against 98%. On the plateau, Prosecco, Sgonico and Borgo Grotta Gigante change by two points at most.29
The stations are not all at the same height above ground or in the same kind of place, and one year of measurements is not yet a climate: the ratios give an order of magnitude, not the wind under a particular window.29
On the coast road between Barcola and Duino no station measures the wind on land. Satellite radars measure it over the sea, working back from the roughness of the water. Two different measurements say this:
RADARSAT, 6 days in 2003 (Signell and others, 2010)Sentinel-1, 44 days 2014-2026 (TriesteVillas analysis)Sentinel-1, middle half of the days
| Barcola | 91% | 128% |
| Grignano and Miramare | 70% | 113% |
| Between Grignano and Santa Croce | 80% | |
| Santa Croce | 74% | 80% |
| Aurisina | 77% | 87% |
| Sistiana | 93% | 93% |
| Duino | 87% | 107% |
Off Santa Croce the two measurements agree: the wind over the sea is between three quarters and four fifths of the wind off the Molo.5,6 Off Barcola and Grignano they disagree: the 2003 radar, on six days, saw less wind than at the Molo; Sentinel-1, on 44 days, sees more.5,6 They were made in different ways on different days, and for now the honest answer there is that we do not know. Towards Duino the two measurements come close again: off Sistiana they coincide, off Aurisina and Duino Sentinel-1 sees somewhat more wind than the radar.5,6 One day is not the median: on 16 of the 44 days, off Santa Croce, the wind over the sea was stronger than at the Molo.6 In any case this is wind over the sea, one to three kilometres from the shore: not the wind in a garden.
On the coast road there is, however, one measurement close to the shore: the OGS MAMBO buoy, at sea about six hundred metres from Miramare Castle, which measures the wind hour by hour.30 In the episodes between September 2025 and October 2026 in which it measured, 42 of 49, it had a median 83% of the Molo's mean wind: 72% in the 17 winter episodes, 97% in the others.30 This is not the same comparison as the satellites, which set sea against sea: the buoy sits on the water, and we compare it with the Molo, on land. Its winter figure is close to the 2003 radar's off Grignano, also measured in winter, and far from Sentinel-1's: it is a clue, not yet an answer.5,6,30
A night of Bora: 8 August 2026, hour by hour
In the 3D view at the top of the page, 'The Bora of 8 August 2026' replays a real episode, hour by hour. At the Molo it lasted 23 hours, from the evening of 7 August to the evening of the 8th.8,29 The strongest moment came around two in the morning: 49 km/h mean wind and a gust of 81 km/h, from 53°.1
In the same hour the buoy in the middle of the gulf had 45 km/h mean and a 68 km/h gust; the buoy off Miramare 43 and 58; Muggia 33 and 72; the Nautical Institute 30 and 65; Prosecco, on the plateau, 29 and 50; Borgo Grotta Gigante 22 and 45.1,30 On the plateau, where the Bora comes from, the mean wind was between less than half and three fifths of the Molo's.
04. If you are looking for a home
What it means for a home
The zone tells you how much Bora reaches that stretch of land. Then the home itself matters: the floor, the terraces, what stands around it. Here is what to look at.
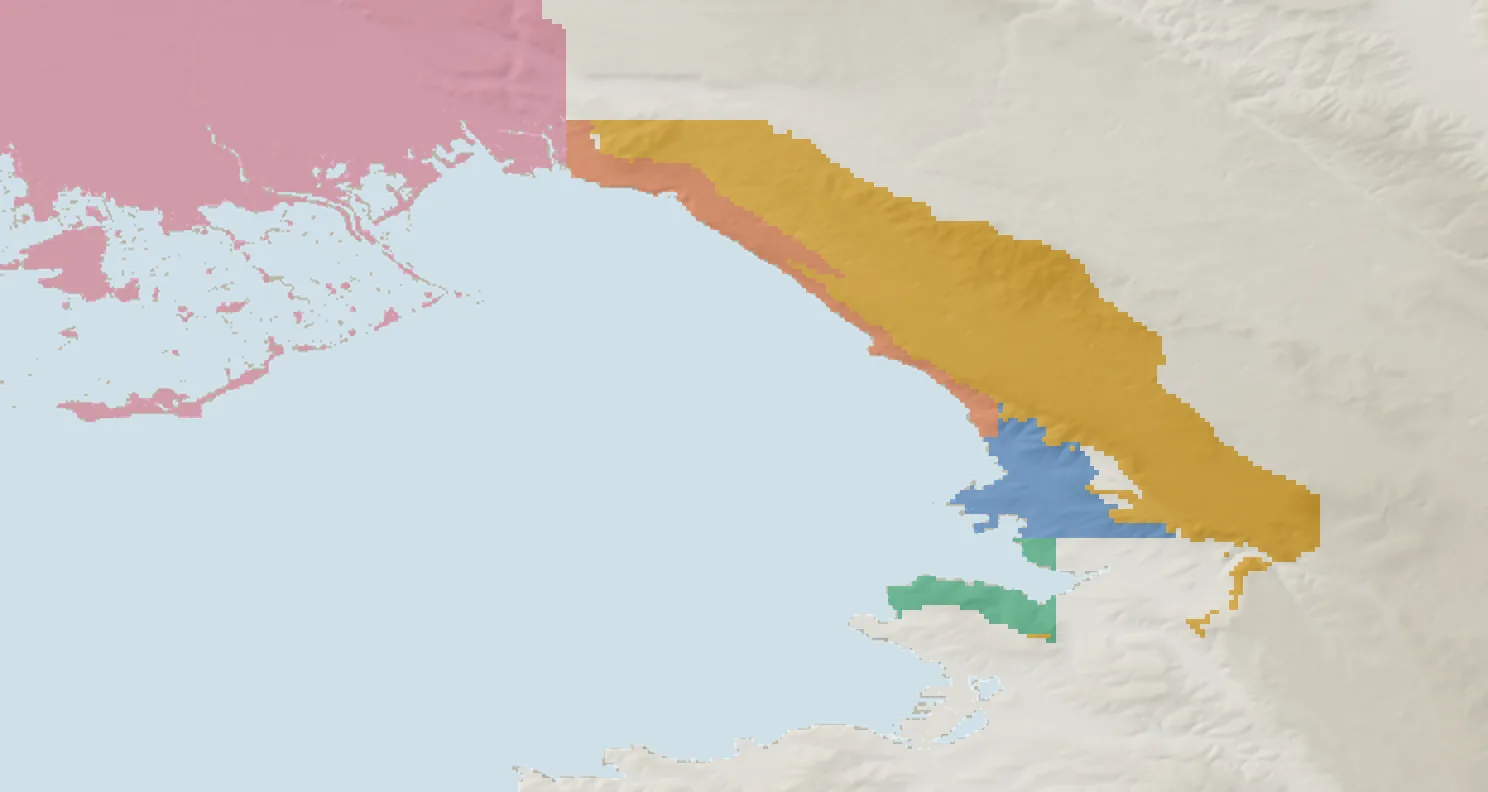
- City
- Muggia
- Coast road
- Hills and Karst
- Monfalcone and lagoon
- no zone
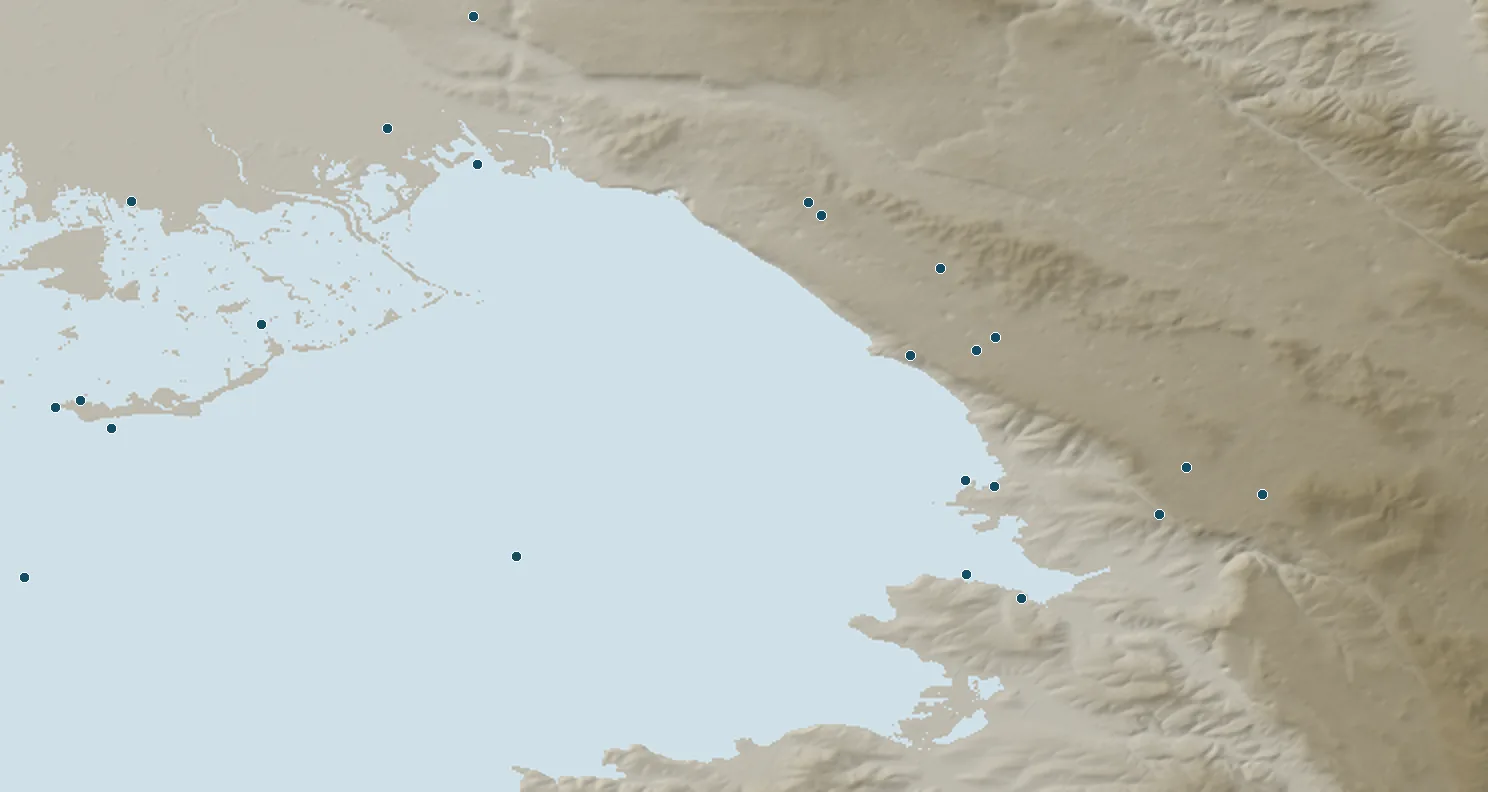
- weather station
Where it comes from
From the east-north-east. Terraces and façades on that side are the first things to check when you view a home.
Bora: 40° to 100°
The home matters more than the zone
The floor, the buildings and trees around it: no station kilometres away can see them. That is why our listings only state what has been measured.
Built for a stronger wind
Italy's building code gives the province of Trieste its own wind zone: buildings are designed for a wind pressure 44% higher than in the rest of the region.
Sources25
When it blows hard
Pots, awnings and covers firmly secured; don't stop under trees or scaffolding. That is the Civil Protection's advice.
Sources26
In every listing
Below the map, the box 'The Bora here' gives the home's zone and its measurements.
On the coast road, a real measurement
Nobody measures the wind on land there: we want to install our own station and compare it with the Molo, episode by episode.
The homes
For every home we measure what can be measured: the sun, the elevation, the sea and, where the data allow it, the Bora. In each listing, under the map, the box 'The Bora here' gives the home's zone and its measurements.
See the homesThe zones, with every measurement
The data on this page allow a first classification by zone. It is experimental: it rests on a few stations, on one year of Bora, and on the sea seen by satellite and by the buoy off Miramare where nobody measures on land. For each zone, the mean wind and the strongest gust of its stations in the Bora episodes between September 2025 and October 2026, relative to the Molo F.lli Bandiera.5,6,29,30 The same classification appears in each home's listing, under the map, in the box 'The Bora here'.
| Zone | Mean wind | Gust |
|---|---|---|
| The open gulfthe buoys out at sea | 91-101% | 79-88% |
| The waterfront and the centrethe Molo F.lli Bandiera and the Nautical Institute, among the buildings | 67-100% | 87-100% |
| Muggiathe Muggia waterfront | 81% | 85% |
| The coast roadfrom Barcola to Duino: no station on land; the wind over the sea from satellites and from the buoy off Miramare | Sentinel-1: 80-128%2003 radar: 70-93%Miramare buoy: 83%wind over the sea, not on land | |
| The hills and the Karst plateauCattinara, Prosecco, Sgonico and Borgo Grotta Gigante, between 257 and 275 metres | 45-66% | 61-74% |
| Monfalcone and the lagoonMonfalcone, Grado, Fossalon, Doberdò and Gorizia airport | 28-72% | 52-83% |
Within each zone it is the house that makes the difference: the floor, the façades and terraces facing east-north-east, the buildings and trees around. None of this is seen by a station kilometres away. That is why in our listings we write about the Bora only what has been measured for that house or for the stretch of sea in front of it, and we do not write that a house is sheltered unless we have measured it.
The building code treats it separately too. Italy's 2018 Technical Standards for Construction divide the country into nine wind zones: the province of Trieste is a zone of its own, with a reference wind speed of 30 metres per second against 25 in the rest of Friuli Venezia Giulia, and the wind pressure used to design buildings is 44% higher.25 It is a ten-minute mean expected once in fifty years, not a gust.
For residents, the Civil Protection advice for strong wind applies: secure pots and objects on balconies and window sills, check awnings and fabric structures, do not stand under trees and scaffolding.26 The Bora comes from the east-north-east: terraces and façades on that side are the first to look at when you visit a house.
On the coast road, where nobody measures the wind on land, we want to install a station of our own, to be compared with the Molo F.lli Bandiera episode by episode. When it has seen enough Bora, its numbers will appear here: even if they say the Bora there is as strong as at the Molo.
05. How it forms
A wind that falls off the Karst
Cold, dry air from central and eastern Europe spills over the Dinarides and the Karst, mountains about a kilometre high.
Above the mountains the air forms waves that break: beneath them the flow speeds up downhill, like water going over a step.
Above Trieste the Karst ends in an escarpment about five kilometres from the Molo: the last drop before the sea.
'Clear' Bora: blue skies, with high pressure: the more common
'Dark' Bora: clouds, sometimes rain or snow, with low pressure
The physics, for the curious
The Bora forms when cold, dry air from central and eastern Europe crosses the Dinaric Alps and the Karst, ridges about a kilometre high, and flows down to the sea. It is pushed by high pressure to the north-east, or drawn in by low pressure over the Adriatic or the Mediterranean.9
Until the 1980s it was explained by the weight of cold air sliding down under gravity. We now know that strong Bora is something else: air passing over the mountains forms waves, the waves break, and beneath the breaking the flow accelerates downhill, like water going over a step and then jumping.9 Two numbers show that weight alone is not enough: 20 metres per second of wind from gravity alone would need air about 25 °C colder, and the strongest wind is not at the ground but around half a kilometre up.9
Above Trieste the Karst is a plateau between 350 and 500 metres that ends in an escarpment, about five kilometres from the Molo; from there the ground drops to the city and the sea within four kilometres. It is the last step the Bora crosses before the gulf.4
It does not come down evenly: where the mountains are lower it is funnelled into jets, with calmer zones in between. In the northern Adriatic there are four main jets; the strongest is at Senj, in Croatia, and the Trieste jet crosses the whole northern Adriatic.11
It is a wind that comes in blows. At Senj, where it has been measured second by second, the gusts return every 3 to 11 minutes; we have not found such a measurement for Trieste.10 And there are two kinds: 'clear' Bora, with blue skies, linked to high pressure, the more common; and 'dark' Bora, with clouds and sometimes rain or snow, linked to low pressure.9
06. What it brings
What the Bora brings with it
Clear skies
Cold, dry air, usually under clear skies: the Karst has the lowest average humidity in the region.
Sources16
Clean air
In winter 2019-2020, while pollutants stagnated across the rest of the region, the Bora and easterly winds diluted them in the gulf.
Sources23
- −8 °C
The cold you feel
At 0 °C with a 50 km/h mean wind, the wind chill is about −8 °C.
Sources24
- 25.5 → 19.1 °C
A cool sea in summer
On 24 June 2024 the Bora brought bottom water to the surface: in two days the sea fell from 25.5 to 19.1 °C.
Sources20
- 4 °C
Cold to the seabed
In winter 2012 the water on the floor of the gulf dropped to 4 °C, denser than in 1929.
Sources21
- 2020
It even stops the Barcolana
In 2020 the regatta was cancelled because of strong Bora and rain. Trieste has even given the Bora its own museum, the Museo della Bora.
Air and sea in detail
It brings cold, dry air and usually clear skies: the Karst has the lowest mean humidity in the region, partly because of it.16 It cleans the air: in winter 2019-2020, while pollutants stagnated in the rest of the region, in the Gulf of Trieste the Bora and the easterly winds diluted them.23
In winter the cold feels sharper: at 0 °C with a 50 km/h mean wind the wind chill is about −8 °C, according to the US weather service formula.24 In February 2012, the month of the longest Bora, Trieste had seven days when the temperature did not rise above freezing.13
In summer it brings cool water. On 24 June 2024 the Bora brought bottom water to the surface: in two days the mean sea temperature at two metres in Trieste fell from 25.5 to 19.1 °C, and was back at 26.8 °C six days later.20
In winter it chills the sea to the bottom. Between late January and mid-February 2012 the Gulf of Trieste's daily mean heat losses exceeded a thousand watts per square metre, and at the bottom the water fell to 4 °C, denser than the water measured in 1929.21 Water of record density formed across the northern Adriatic.22
And sometimes it stops the city: in 2020 the Barcolana regatta was called off because of strong Bora and rain.27 Trieste has even given the Bora a museum, the Museo della Bora, with its Borarium in Opicina, open by appointment.28
07. Questions
The questions of buyers from afar
The short answers, with the numbers from the chapters above.
How many days a year does the Bora blow in Trieste?
It depends how you count. At the Trieste station, in 2006-2011 and 2013-2014, there were on average 147 days a year with at least three hours of Bora above 18 km/h, 74 with gusts of 60 km/h or more and 6.6 with gusts of 100 km/h or more.
Which months does it blow in?
All year round, most from October to March. In January, October and December about fifteen days a month have at least three hours of Bora; in May and June about eight.
Does it blow in summer too?
Yes. In July and August 10 to 12 days a month have at least three hours of Bora, with three or four days of 60 km/h gusts. Between June and August 2026 the Molo had 9 Bora episodes; the strongest, on the night of 7 to 8 August, had a gust of 81 km/h.
How long does it last?
An episode lasts 8 hours in the median. One in ten goes beyond 30; the longest, in the years considered, lasted about 6 days.
How strong are the gusts?
At the Molo F.lli Bandiera the year's strongest gust averages 128 km/h; ARPA's record is 168 km/h, on 11 February 2012. Stronger gusts have been measured in the city, up to about 187 km/h on the roof of the Nautical Institute on 10 March 2010.
Is it cold when the Bora blows?
In winter yes, and the wind makes it feel colder: at 0 °C with a 50 km/h mean wind the wind chill is about −8 °C, by the wind chill index of the Canadian and US weather services. In summer it brings clear air and cool sea: on 24 June 2024 the sea in Trieste dropped from 25.5 to 19.1 °C in two days.
Is the Bora changing?
In the twentieth century it decreased slightly, with swings lasting decades. Over the last thirty years, at the Molo, days with a mean wind above 36 km/h have stayed almost the same. Climate models project slightly less winter Bora in the northern Adriatic, with much uncertainty.
What does it mean for a home?
In Trieste buildings are designed for stronger wind than in the rest of the region: the building code gives the province a wind zone of its own. For a home, what matters is the zone, the floor, and the terraces and façades facing east-north-east, where the Bora comes from. In our listings we write only what has been measured.
Where does it blow hardest?
Among the stations that measure it, over the open sea and on the waterfront. In the Bora episodes between September 2025 and October 2026 the Karst plateau had between 45 and 66% of the mean wind at the Molo F.lli Bandiera, Muggia 81%. On the coast road nobody measures it on land; over the sea off Santa Croce satellites see between three quarters and four fifths of the Molo's wind, off Barcola and Grignano the two measurements disagree, and the buoy off Miramare had 83%.
08. For those who want to check the maths
Behind the numbers
Where the data come from, how we counted, and what we do not know. And every source, one by one.
Why an estate agency writes about the Bora
'How strong is it? How many days a year? In summer too? And where?' These are the Bora questions buyers ask us most often, especially those who come from abroad and know it only by reputation. People born in Trieste usually answer with a story. The stories are true, but choosing a home takes numbers.
For every home we offer we measure what can be measured: how many hours of sun the terrace gets, how high it stands, how warm the sea is below the house. This page does the same with the wind. It sets out what can honestly be said about Trieste's Bora, with numbers from weather stations, satellites and terrain, and the sources at the bottom. It also says what is not known.
We are not a weather service and do not want to look like one. The data come from the Friuli Venezia Giulia environmental agency (ARPA) and Civil Protection, from Italy's National Institute of Oceanography and Applied Geophysics (OGS), from the American NOAA and from the European Copernicus programme;1,2,4,29,30 the calculations are ours, and anyone can repeat them. We do it because anyone buying a home, from Trieste or from Vienna, should be able to see all the data that exist, not just the photographs.
Where the headline figures come from
The first two figures come from the Trieste synoptic station in the years when it measured consistently, 2006-2011 and 2013-2014; the other two from ARPA at the Molo F.lli Bandiera, since 1994.2,3,12 The Bora blows all year round, more from October to March and less in May and June; when the wind in Trieste goes above 18 km/h, 91 times out of a hundred it is the Bora.2 How much of it arrives depends a great deal on the place: in the 49 Bora episodes between September 2025 and October 2026, winter included, the Karst plateau had between 45 and 66% of the Molo's mean wind, the buoy in the middle of the gulf 101%.29
How we counted, and what we do not know
- The Bora calendar comes from a single station, Trieste's, and from eight years in which it measured consistently; it is not the climate of the whole province, and it does not say whether the Bora is changing.2,3
- The comparison between stations comes from 49 episodes between September 2025 and October 2026, 19 of them in winter: it is a single year, and another year may give somewhat different ratios.8,29
- Satellites see the wind over the sea, not on land.5,6
- The buoy off Miramare measures on the water: its ratio to the Molo is a clue for the coast road, not the wind on land.30
- Gusts cannot be compared between different instruments, nor at the Molo before and after 2005, when ARPA changed how it measures them.12
- The terrain is the 30-metre Copernicus model: buildings and trees are included, smaller details are not.4
- Every calculation can be repeated: the programs and downloaded data are kept, and we send them to anyone who asks.
The 30 sources
- Note 1. ARPA FVG - OSMER e GRN, weather stations around Trieste: hourly mean wind, hourly maximum wind and direction from 1 August to 23 October 2026, read from the station charts page on 23-24/10/2026 (CC BY-SA 3.0 IT licence). These readings are the source of 8 August 2026 hour by hour, in the 3D view at the top of the page and in its chapter: TriesteVillas processing. meteo.fvg.it (opens in a new tab) · accessed 24/10/2026
- Note 2. TRIESTE synoptic station (WMO 16110, ICAO LIVT), hourly METAR and SYNOP observations in NOAA's Integrated Surface Database (public domain), data from 1932 to 2025. For the figures on this page, the years 2006-2011 and 2013-2014: one observation every hour, calms and gusts recorded the same way. Bora = wind from 40-100° (north-east to east); Bora day = at least three such hours above 18 km/h (5 m/s); gust = the gust reported in the bulletin or, if missing, the mean wind. TriesteVillas processing. ncei.noaa.gov (opens in a new tab) · accessed 24/10/2026
- Note 3. The Trieste series is not homogeneous: calm hours are about 45% in the 1990s, 5% in 2002, back to 30% in 2015-2017 and gone from 2023; 1972, 2005 and 2012 are missing. These are changes of instruments or recording, not of climate. That is why we use it for months, hours and durations, not to say whether the Bora is increasing or decreasing. TriesteVillas calculation on the same series as note 2.
- Note 4. Copernicus DEM GLO-30, 30 m digital surface model (tile N45 E013), © DLR e.V. 2010-2014 and © Airbus Defence and Space GmbH 2014-2018 provided under COPERNICUS by the European Union and ESA. It is a surface model: it includes buildings and trees. Cross-section along 68° through the Molo F.lli Bandiera: TriesteVillas processing. dataspace.copernicus.eu (opens in a new tab) · accessed 24/10/2026
- Note 5. R. P. Signell, J. W. Chiggiato, J. Horstmann, J. D. Doyle, J. Pullen, F. Askari, 'High-resolution mapping of Bora winds in the northern Adriatic Sea using synthetic aperture radar', Journal of Geophysical Research 115 (2010), C04020. RADARSAT radar winds on six Bora days in January-February 2003; the ratios for each stretch of coast are our reading of the colours of figure 10. doi.org (opens in a new tab) · accessed 24/10/2026
- Note 6. Sentinel-1: radar images of 44 strong-Bora days between 2014 and 2026 (at the Trieste station, at the time of the pass, direction 30-100° and mean wind of at least 8 m/s or gusts of at least 15 m/s), from the public Microsoft Planetary Computer catalogue; 10 m wind from the CMOD5.N model; sea cells 1 to 3 km from the shore, downwind, compared with the same off the Molo F.lli Bandiera. TriesteVillas processing, October 2026; the comparison holds for strong Bora. Contains modified Copernicus Sentinel data [2014-2026]. planetarycomputer.microsoft.com (opens in a new tab) · accessed 24/10/2026
- Note 8. Episode, at the Molo F.lli Bandiera: hours with wind from 40-100° and hourly mean wind of at least 20 km/h, with gaps of 2 hours at most, at least 6 hours and a gust of at least 60 km/h. Hours are built from the quarter-hours in note 29, at least three per hour: the mean wind is their average, the gust the strongest of them. A station enters the comparison for an episode if it has wind data for at least three quarters of its hours. TriesteVillas calculation on the data in note 29.
- Note 9. B. Grisogono, D. Belušić, 'A review of recent advances in understanding the meso- and microscale properties of the severe Bora wind', Tellus A 61 (2009), 1-16: the weather patterns that produce it, the downslope windstorm driven by breaking mountain waves, the two arguments against gravity alone, the low-level jet at about half a kilometre, clear and dark Bora. doi.org (opens in a new tab) · accessed 24/10/2026
- Note 10. D. Belušić, M. Pasarić, M. Orlić, 'Quasi-periodic bora gusts related to the structure of the troposphere', Quarterly Journal of the Royal Meteorological Society 130 (2004), 1103-1121: one-second measurements at Senj, December 2001 - January 2002, quasi-periodic gusts between 3 and 11 minutes. doi.org (opens in a new tab) · accessed 24/10/2026
- Note 11. C. E. Dorman and others, 'February 2003 marine atmospheric conditions and the bora over the northern Adriatic', Journal of Geophysical Research: Oceans 111 (2006): the strongest winds are concentrated in four jets steered by topography; the strongest is the Senj jet, the Trieste jet crosses the whole northern Adriatic, and between jets the wind is weak. doi.org (opens in a new tab) · accessed 24/10/2026
- Note 12. ARPA FVG - OSMER e GRN, climatological tables for the Trieste molo F.lli Bandiera station, 1994-2026, updated 5 October 2026 (CC BY-SA 3.0 IT licence): wind at 10 m, monthly maximum wind speed with its direction, days with daily gust above 15, 20 and 25 m/s, days with daily mean wind above 10 m/s, return periods calculated by ARPA. In 2005 ARPA changed how the maximum gust is sampled: gust counts cannot be compared before and after. The shares of Bora months (318 of 381 monthly maxima, 119 of the 130 months with a maximum of 100 km/h or more) and the 1996-2005 / 2006-2025 comparison are TriesteVillas calculations on the same tables. meteo.fvg.it (opens in a new tab) · accessed 24/10/2026
- Note 13. ARPA FVG - OSMER e GRN, Meteo FVG Report 2/2012 (February 2012), 'Event of the month': fifteen consecutive days of gusts above 100 km/h at the Molo F.lli Bandiera from 29 January to 12 February 2012, the 168 km/h gust of 11 February, seven ice days in Trieste during the month. meteo.fvg.it (opens in a new tab) · accessed 24/10/2026
- Note 14. F. Stravisi, S. Cirilli, Dati meteorologici di Trieste, anno 2010, Rapporti OM no. 143, University of Trieste (2011): station of the Department of Geosciences on the roof terrace of the Nautical Institute; March 2010 maximum, 52 m/s from the north-east. arts.units.it (opens in a new tab) · accessed 24/10/2026
- Note 15. ARPA FVG - OSMER e GRN, Il vento in Friuli Venezia Giulia. Schede climatiche (2023), 'Trieste coast and Karst': in Trieste, 2001-2020, mean wind at 10 m of 14 km/h; wind from the north-east 16% of hours, averaging 29 km/h; episodes with an hourly mean above 35 km/h for more than five hours in a row are not rare. meteo.fvg.it (opens in a new tab) · accessed 24/10/2026
- Note 16. ARPA FVG, Il clima del Friuli Venezia Giulia (popular booklet, 2020), pp. 2 and 22: in the city the Bora reaches its greatest strength and persistence, more than on the plateau; it is less present around Muggia; the Karst has the lowest mean annual humidity in the region; north-easterly winds bring fine weather. arpa.fvg.it (opens in a new tab) · accessed 24/10/2026
- Note 17. F. Stravisi, 'Climatic variations at Trieste during the last century', Geofizika 4 (1987), 61-76: wind from north-north-east to east, at any speed, in 1903-1985 for 41.9 ± 5.6% of the time, i.e. 153 ± 21 equivalent days a year; a decline of 0.28 days a year per year, with an oscillation of about fifty years peaking around 1940. ojs.srce.hr (opens in a new tab) · accessed 24/10/2026
- Note 18. A. Belušić Vozila and others, 'Wind over the Adriatic region in CORDEX climate change scenarios', Journal of Geophysical Research: Atmospheres 124 (2019), 110-130: in the 21st century fewer winter Bora episodes in the northern Adriatic and more sirocco; wind speed during the Bora does not decrease; the signal depends strongly on the global model. doi.org (opens in a new tab) · accessed 24/10/2026
- Note 19. C. Denamiel, I. Tojčić, I. Vilibić, 'Far future climate (2060-2100) of the northern Adriatic air-sea heat transfers associated with extreme bora events', Climate Dynamics 55 (2020), 3043-3066: 22 extreme Bora events simulated for the end of the century, with wind up to 3 m/s weaker. doi.org (opens in a new tab) · accessed 24/10/2026
- Note 20. ARPA FVG - OSMER e GRN, Meteo FVG Report 6/2024 (June 2024), table of the daily mean sea temperature in Trieste at 2 m: 25.5 °C on 22 June, 22.5 on the 23rd, 19.1 on the 24th, 26.8 on the 30th. meteo.fvg.it (opens in a new tab) · accessed 24/10/2026
- Note 21. F. Raicich and others, 'Extreme air-sea interactions in the Gulf of Trieste (North Adriatic) during the strong Bora event in winter 2012', Journal of Geophysical Research: Oceans 118 (2013), 5238-5250: daily mean heat losses above 1,000 W/m², bottom water at 4 °C, density anomaly of 30.58 kg/m³, more than in 1929. doi.org (opens in a new tab) · accessed 24/10/2026
- Note 22. H. Mihanović and others, 'Exceptional dense water formation on the Adriatic shelf in the winter of 2012', Ocean Science 9 (2013), 561-572: record densities above 30 kg/m³ on the Adriatic shelf. doi.org (opens in a new tab) · accessed 24/10/2026
- Note 23. ARPA FVG, 'Aria sostanzialmente buona in Friuli Venezia Giulia', Ecoscienza 3/2020: in winter 2019-2020 pollutants stagnated in almost the whole region, except in the Gulf of Trieste, ventilated by the Bora and easterly winds. arpae.it (opens in a new tab) · accessed 24/10/2026
- Note 24. NOAA National Weather Service, 'Wind Chill Chart': the wind chill formula, valid below 10 °C with wind measured at 10 m. With 0 °C and a 50 km/h mean wind it gives about −8 °C: TriesteVillas calculation. weather.gov (opens in a new tab) · accessed 24/10/2026
- Note 25. Ministerial Decree of 17 January 2018, updated Technical Standards for Construction, Official Gazette no. 42 of 20 February 2018, ord. suppl. no. 8, §3.3.1, table 3.3.I: zone 8, province of Trieste, basic reference wind speed 30 m/s; zone 1, the rest of Friuli Venezia Giulia, 25 m/s. It is a 10-minute mean at 10 m with a 50-year return period. The 44% higher pressure is (30/25)², TriesteVillas calculation with the formula in §3.3.6. gazzettaufficiale.it (opens in a new tab) · accessed 24/10/2026
- Note 26. Italian Civil Protection Department, 'In caso di venti e mareggiate' (sheet republished by the Prefecture): secure objects exposed to the wind, such as pots on balconies and window sills, aerials and roof coverings; take care with structures made of fabric; avoid standing under trees and scaffolding, since broken branches are the most frequent injury. prefettura.interno.gov.it (opens in a new tab) · accessed 24/10/2026
- Note 27. ARPA FVG - OSMER e GRN, 'Il tempo meteorologico durante la Barcolana: anni 1994-2021', Trieste molo F.lli Bandiera station: in 2020 the regatta was called off because of bad weather, with strong Bora and rain. snpambiente.it (opens in a new tab) · accessed 24/10/2026
- Note 28. Museo della Bora (Bora Museum): the association and the Borarium at Via Nazionale 49 in Opicina, visits by appointment. museobora.org (opens in a new tab) · accessed 24/10/2026
- Note 29. Source: Protezione Civile della Regione Friuli Venezia Giulia (Civil Protection of the Friuli Venezia Giulia Region), weather monitoring data (CC BY 4.0 licence): mean wind, gust and direction every fifteen minutes, since 20 September 2025, from the stations of the regional network, the same as in note 1. Over the 31 hours of 8 August 2026 the gusts match those on ARPA's page and the mean wind differs by at most 0.7 km/h, at all fourteen stations. Data processed by TriesteVillas and kept in its archive, which updates itself every half hour: for each episode and each station, mean wind and strongest gust over the same hours, relative to the Molo; for each station, the median of the episodes, and in the figure the middle 80%. Winter: the episodes that began between November and March. The stations are not all at the same height above ground nor in the same kind of place. monitor.protezionecivile.fvg.it (opens in a new tab) · accessed 25/10/2026
- Note 30. OGS - National Institute of Oceanography and Applied Geophysics, MAMBO1 buoy in the Gulf of Trieste off Miramare (45.698 N, 13.708 E): mean wind, gust and direction hour by hour since October 2023, from the OGS ERDDAP server. These data were collected and made freely available by the Copernicus project and the programmes that contribute to it. Values flagged by quality control as probably bad, bad or missing are excluded. The anemometer is on the buoy, closer to the water than the Molo's ten metres. Ratios to the Molo of note 29, over the same hours and by the same rules: TriesteVillas processing. nodc.ogs.it (opens in a new tab) · accessed 25/10/2026
Written with AI and checked against the sources by the TriesteVillas editorial team. How we use AI →
The ARPA FVG - OSMER e GRN station data are released under the CC BY-SA 3.0 IT licence: our processing of those data on this page may be reused under the same licence, crediting ARPA FVG - OSMER e GRN and TriesteVillas. Station comparisons, source: Protezione Civile della Regione Friuli Venezia Giulia; data processed by TriesteVillas; CC BY 4.0 licence (creativecommons.org/licenses/by/4.0). MAMBO1 buoy: OGS, data collected and made freely available by the Copernicus project. NOAA data are in the public domain. Contains modified Copernicus Sentinel data [2014-2026]. Relief: Copernicus DEM GLO-30. Regional border and place locations: © OpenStreetMap contributors, ODbL licence.
This is neither a forecast nor a bulletin: for wind warnings, refer to ARPA FVG-OSMER and the Civil Protection of Friuli Venezia Giulia.